Electrochemical characterization
We develop membrane electrode assemblies mainly for proton exchange membrane fuel cells and water electrolyzers. The evaluation of these electrochemical energy converters is typically performed by single-cell testing in our team. Electrochemical characterization is used to elucidate their performance and important parameters such as the electrochemically active surface area of the electrodes or the fuel crossover over the membrane. Here, the characteristic data of and analytic tools for proton exchange membrane fuel cells (PEMFCs) are provided as an overview. The fuel cell converts chemical energy from a fuel (hydrogen) into electrical energy by oxidizing the fuel to water: It produces electricity from hydrogen and oxygen and emits pure water.
Polarization data
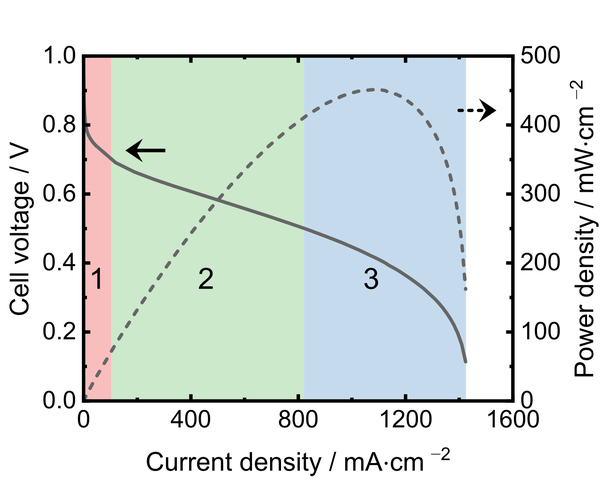
The polarization curve (i-V curve) is one of the most common techniques for characterizing fuel cells. Usually, polarization curves are obtained galvanostatically, which means that a fixed current is drawn from the fuel cell, and the voltage response is measured. An important characteristic of a polarization curve is the open-circuit voltage, which is the cell voltage at zero load. Further, the polarization curve can be divided into three regions, as indicated in the figure:
- At low current densities, the cell voltage drop is caused by activation losses, which are related to the employed catalyst layers.
- At medium current densities, the cell voltage drops linearly due to the Ohmic cell resistance, which is mainly caused by the ionic resistance of the membrane.
- At high current densities, concentration polarization (mass transport losses) occurs, which is a steep voltage drop due to the insufficient supply of gases and the insufficient removal of product water.
The product of current density and voltage displayed over the current density is the power density curve (dashed line in the figure), which allows an easy comparison of fuel cells characterized under the same operating conditions. Single-cell testing of fuel cells is performed with 850e fuel cell test stations from Scribner Associates Inc. in our labs. These systems can operate single cells with up to 25 cm² cell area at up to 180°C and more and provide a software-controlled selection of the gas supply and flow rate, feed gas humidification, and backpressure.
Electrochemical impedance spectroscopy
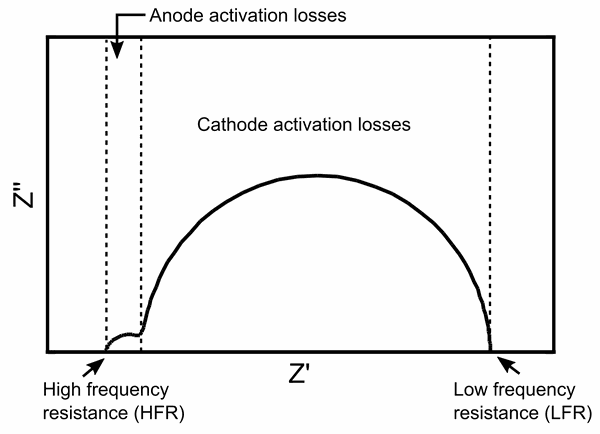
Impedance spectroscopy is a technique to measure fuel cell resistances. For example, the polymer electrolyte within a proton exchange membrane fuel cell is one the most significant sources of resistance, the so-called Ohmic polarization that represents the resistance to ionic conduction between the electrodes. The resistance of the membrane depends on the operating conditions, which is why it is important to characterize these resistances during cell testing.
In electrochemical impedance spectroscopy, this resistance is determined by applying an AC signal to the electronic load of a fuel cell to modulate the DC load current. As a result, the magnitude and phase shift of the voltage response to the AC signal can be evaluated. This data provides in-depth information about various parts of a fuel cell, like the Ohmic resistance (high frequency resistance in impedance spectroscopy), activation losses, and mass transport losses. We use VP-300 and VSP-300 potentiostats from BioLogic to measure the impedance spectra of single cells.
Further electrochemical characterization tools
Additional electrochemical characterization of single cells enables the determination of parameters such as the fuel crossover or the electrochemically active surface area of a fuel cell. These measurements require a change in the operation mode of the cell: Instead of operating as a fuel cell (hydrogen and oxygen), the cell is operated with hydrogen and nitrogen.
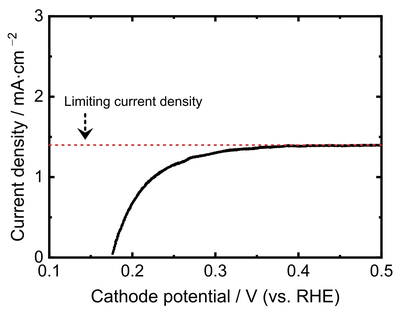
Linear sweep voltammetry is performed to quantify fuel crossover, which is the undesired diffusion of hydrogen from the anode to the cathode of the fuel cell. Fuel crossover reduces the system efficiency by consuming hydrogen without contributing to the production of electricity. Additionally, fuel crossover accelerates the degradation of a fuel cell. Fuel crossover scales with membrane thickness but is also dependent on the membrane material and can be reduced by implementing reinforcement layers into the membrane that hinder hydrogen diffusion. When replacing the air or oxygen supply at the fuel cell cathode with nitrogen and applying a voltage to the cell, hydrogen that has diffused to the nitrogen side can be 'pumped' back electrochemically to the hydrogen side.
This process is self-limiting once the hydrogen pump rate is equal to the fuel crossover rate. Thus, the fuel crossover can be determined within the fuel cell. This measurement is performed by sweeping the voltage from lower to higher values, hence the name of the method (linear sweep voltammetry). The electrical current that is obtained in this method represents the fuel crossover and can be converted into a hydrogen diffusion rate by using Faraday's law.
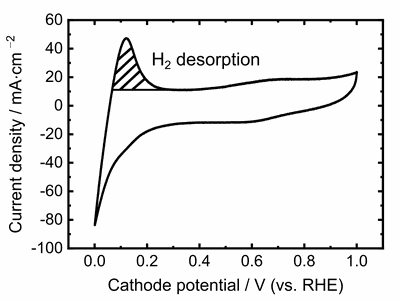
Similarly, the measurement setup with nitrogen and hydrogen supply to the cell can be used to evaluate the electrochemically active surface area of the catalyst layer of a fuel cell. The cell voltage is swept forth and back between two voltage limits at a fast rate, and the resulting current response is recorded. This data enables a calculation of the catalyst surface area that is participating in electrochemical reactions, and the method is termed cyclic voltammetry. Cyclic voltammetry can be used to compare different catalyst layer formulations with each other, to evaluate aging effects, or to determine catalyst poisoning by feed gas contaminations.